
BTC Tests Critical $68K Support as Momentum Weakens
Bitcoin is approaching an important technical area as price action tests key support within a rising channel structure. Current market conditions show weakening momentum and increasing technical pressure, creating uncertainty about whether BTC can maintain its structure or face another downside move.
Traders are closely monitoring momentum indicators, moving averages, and liquidity zones to determine whether Bitcoin can stabilize or if further downside risk remains.
Bitcoin Tests Key Technical Support
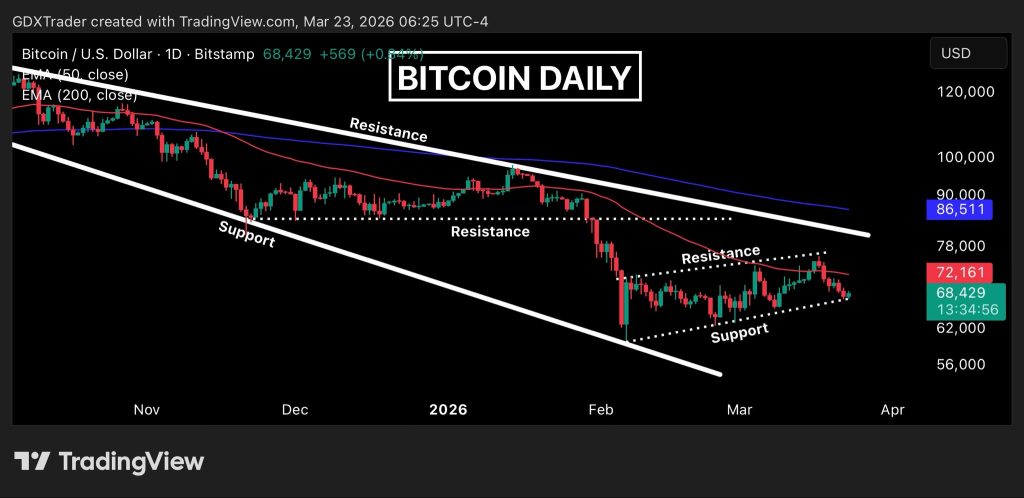
Bitcoin is approaching a critical technical decision zone as price tests the lower boundary of an ascending channel. The outlook remains fragile as BTC attempts to hold support near the $68K region while broader technical signals continue to reflect bearish pressure.
Bitcoin is currently forming an inside range candle near channel support, typically signaling short term indecision between buyers and sellers. Charts confirm BTC trading below both the 50 day and 200 day moving averages, which are sloping downward and acting as dynamic resistance. This supports the view that the broader trend remains under pressure despite temporary stabilization.
A similar technical situation was recently discussed in Bitcoin consolidates near $69K as liquidity data shows key support levels, where analysts also pointed to strong reactions around the same price zone.
Momentum Indicators Signal Weakness
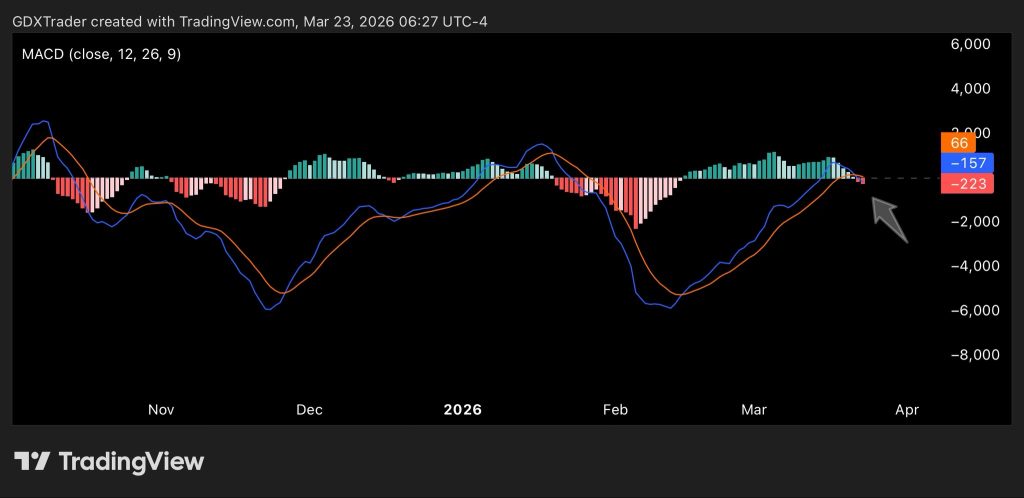
Momentum indicators further support the cautious outlook. The MACD is approaching a bearish crossover, which typically signals weakening bullish momentum and lack of follow through from buyers. The broader structure also shows Bitcoin trading within a descending broadening pattern while attempting to hold short term structure.
Similar downside risks were outlined in Bitcoin tests $65K support after 10% correction, where key technical scenarios also depended on whether support levels could hold.
Liquidity Risks Remain Important
Despite holding support, price remains under declining moving averages, meaning any bounce could be corrective rather than a confirmed reversal. Liquidity risks around nearby levels were also highlighted in BTC price analysis showing $3.4B long liquidations near $66K, reinforcing the importance of nearby support zones.
The current situation reflects a market still lacking confirmation of a trend shift. From a psychological perspective, bulls are attempting to defend support, but without improving momentum or structural change, rallies may continue to be viewed as distribution opportunities.
What This Means for BTC Price Outlook
Until Bitcoin reclaims key resistance levels and momentum indicators improve, BTC may remain vulnerable to continued consolidation or further downside tests. Current technical conditions suggest traders should closely watch whether support holds or breaks as momentum continues to weaken.