
BTC Fractal Points to Q2–Q3 2026 Bottom
Bitcoin’s long-term price structure is beginning to resemble prior macro cycle formations, according to a recent fractal analysis shared by market observer Haider. The comparison highlights structural similarities between the 2021–2022 downturn and the current 2024–2026 cycle, suggesting that BTC may not reach a durable bottom until late Q2 or early Q3 2026.
On the weekly timeframe, the current pattern reflects a rounded distribution top followed by an aggressive correction phase — a structure that closely mirrors previous cycle behavior. If historical symmetry continues to unfold, Bitcoin could enter an extended consolidation period before any sustained bullish reversal develops.
Rather than signaling an imminent recovery, the fractal projection points toward several months of sideways movement. This type of compression phase has historically served as a structural reset, allowing leverage to unwind and long-term support levels to form before the next expansion cycle begins.
Fractal Structure and Market Comparison
Historical Cycle Parallels
During the previous macro cycle, BTC topped before entering a prolonged corrective environment. That decline eventually transitioned into a broad accumulation range, lasting multiple months before price regained upward momentum.
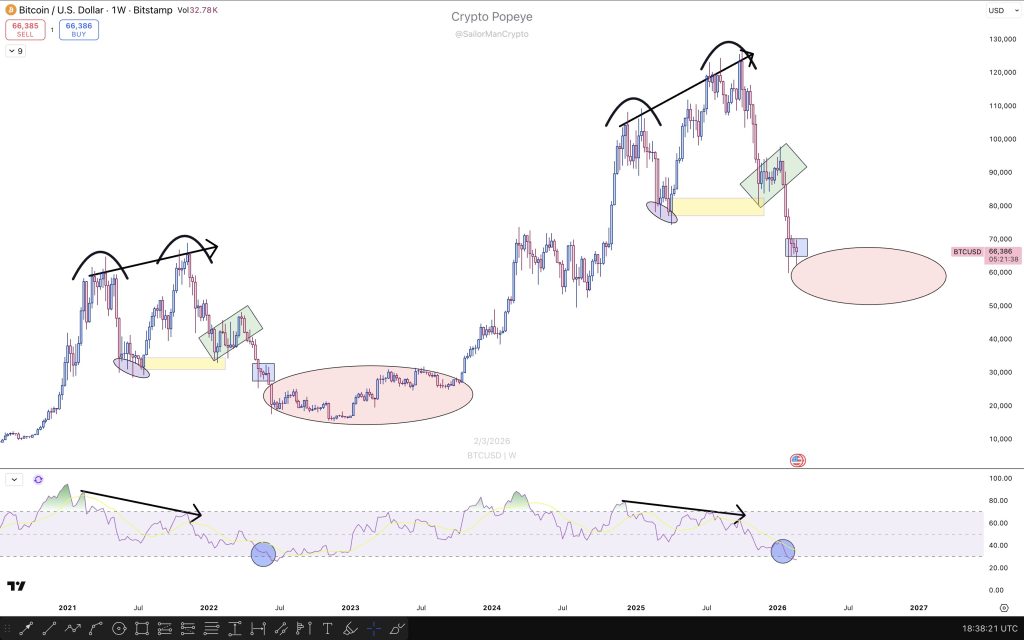
The current structure appears to be evolving along similar lines. After declining from recent highs, Bitcoin is approaching a projected consolidation zone that could define the final stage of this corrective phase. The fractal overlay suggests that this bottoming region may develop gradually rather than through a sharp V-shaped reversal.
If the pattern continues to track historical precedent, traders should expect extended ranging behavior instead of immediate upside acceleration.
RSI Confirmation
Momentum indicators further reinforce the comparison. In both cycles, the Relative Strength Index weakened materially after the macro peak and continued trending lower throughout the corrective phase. This alignment between price structure and momentum behavior strengthens the broader fractal thesis.
As noted in the analysis:
“The BTC fractal is still playing out according to plan, with a projected bottom forming around the end of Q2 or the beginning of Q3 2026.”
Why This Matters
Fractal analysis does not guarantee outcomes, but it offers a structured framework for interpreting long-term market cycles. If Bitcoin follows the same rhythm observed in prior macro phases, the path forward may require patience rather than immediate bullish expectations.
Extended consolidation historically acts as a rebuilding mechanism — reducing speculative excess, compressing volatility, and establishing stronger structural foundations. Such environments have often preceded significant expansion phases once accumulation is complete.
Outlook Toward 2026
If historical symmetry remains intact:
- Bitcoin may trade sideways into mid-2026
- Volatility could compress before expanding in a new directional phase
- A stronger structural base may form before the next sustained rally
That said, macroeconomic variables remain critical. Liquidity conditions, regulatory developments, and broader risk appetite could either accelerate or delay the projected timeline.
My Take
This fractal framework provides a coherent long-term roadmap, but markets rarely replicate historical patterns with precision. While the Q2–Q3 2026 window appears technically plausible, flexibility remains essential.
If this consolidation scenario unfolds, disciplined positioning and risk management will likely matter more than short-term directional bets.
Source: Popeye