
Bitcoin Price Analysis: Bearish Structure Dominates as BTC Tests Support Below Key Moving Averages
Bitcoin continues to trade under pressure as the broader technical structure remains bearish despite attempts at short term stabilization. Recent price action shows BTC struggling to regain momentum while trading below important technical levels that previously acted as dynamic support. As market uncertainty persists, traders remain cautious while watching whether Bitcoin can defend current support zones or face another leg down.
Weak Recovery Inside Broader Downtrend
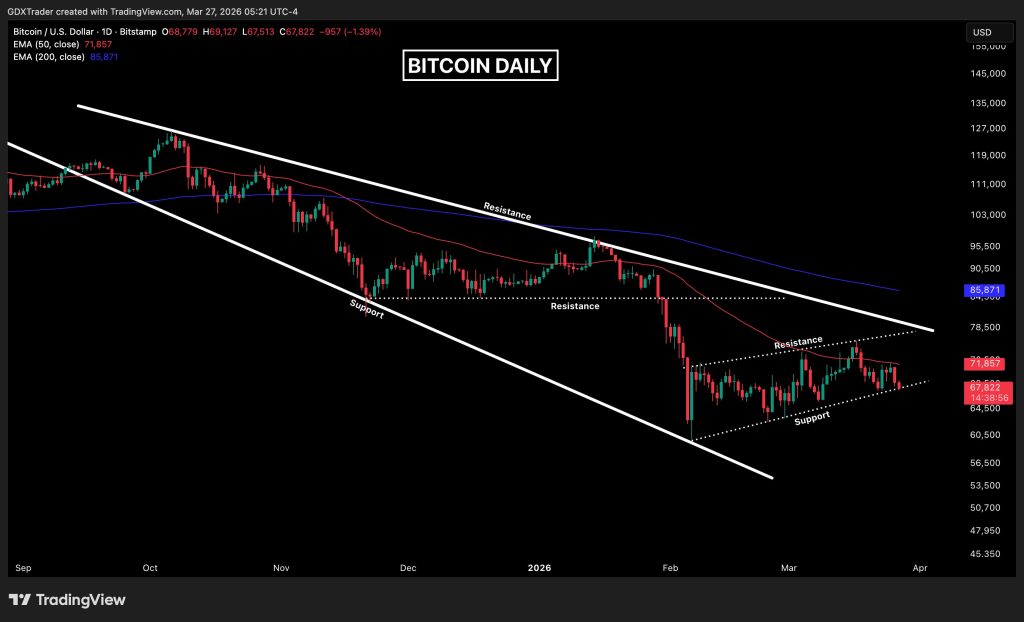
Bitcoin continues to show bearish structure as price action remains trapped inside a larger downtrend despite attempts at short term stabilization. The analysis, based on daily chart data, shows BTC printing another bearish continuation candle while testing support within a short term ascending channel.
Bitcoin is currently forming a weak recovery structure within a broader descending expanding wedge, a pattern typically associated with continuation pressure rather than reversal. The chart also shows BTC trading below major moving averages, including the 50 EMA and the 200 EMA, reinforcing the dominant bearish structure.
The immediate risk comes from continued downside momentum as price presses into support while bearish pressure remains dominant. This reflects ongoing selling pressure with limited signs of strong demand entering the market. Similar conditions were recently discussed in BTC tests critical $68K support as momentum weakens, where analysts noted that fading momentum continues to favor sellers.
Technical Resistance Levels Hold the Key
The alternative bullish scenario would require Bitcoin to reclaim key resistance levels, particularly moving back above major moving averages and breaking the upper boundary of the short term channel. Without this, the structure continues to favor downside continuation.
This remains a technically weak environment where short term strength may continue to attract sellers. Comparable structural weakness was also highlighted in Bitcoin consolidates near $69K as liquidity data shows key support levels, where liquidity analysis showed how fragile support zones can increase downside risks when buying pressure remains weak.
The broader context shows Bitcoin continuing to trade within a fragile technical range, with market psychology reflecting hesitation from buyers. Until bulls demonstrate conviction through strong candles and sustained buying pressure, volatility may remain elevated. Comparable consolidation dynamics were also described in Bitcoin locked in $62K-$74K range since February 2025, which highlighted Bitcoin’s difficulty in establishing a clear directional trend during extended consolidation phases.