
Bitcoin Moves Into Key Volume Gap Around $69,141
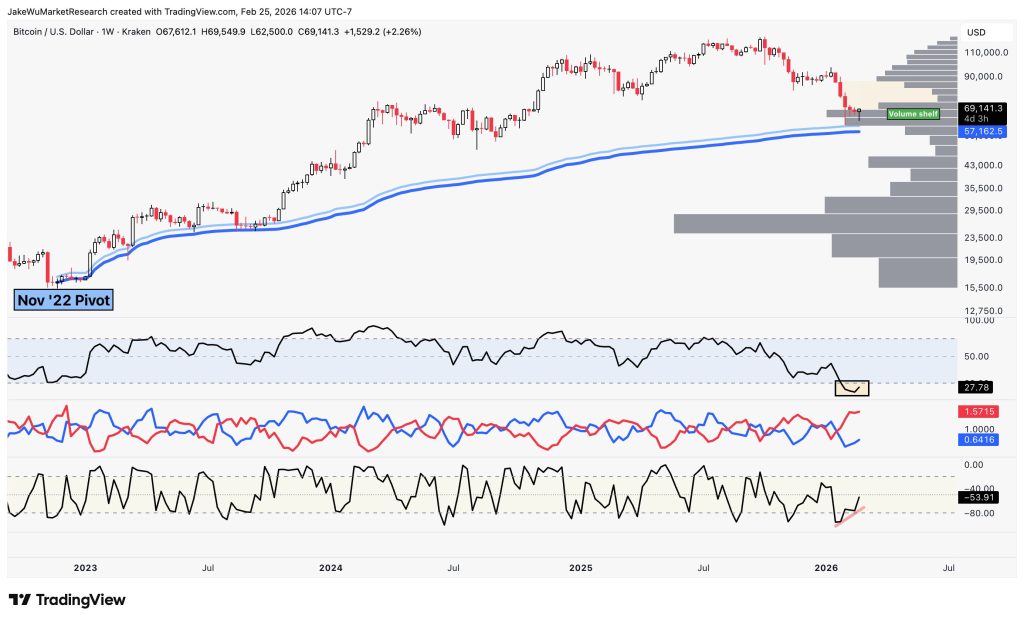
Bitcoin is trading around $69,141 on the Kraken weekly pair, up approximately 2.26 percent, as price action begins to move into a visible volume gap on the weekly chart. This development marks a technically important shift, as BTC transitions away from a high-volume consolidation area and into a thinner liquidity zone.
The move places Bitcoin above a previously established high-participation node near $57,162 and into a region where historical transaction density is significantly lower. In volume profile analysis, such gaps often act as acceleration corridors, where price can expand more quickly if momentum remains aligned with the prevailing trend.
Key Technical Development
Volume Profile Structure
The weekly chart highlights a pronounced high-volume shelf below the current market price and a comparatively lighter traded region above it. This lighter zone, commonly referred to as a volume gap, represents an area where fewer historical transactions occurred.
When Bitcoin advances into such a zone, resistance levels tend to be less defined because fewer market participants previously established positions there. As a result, price can sometimes move more efficiently through the area, particularly when supported by strengthening momentum.
The transition away from the high-volume node near $57,162 reinforces the idea that BTC is attempting to establish acceptance at higher price levels rather than rotating back into its prior consolidation base.
Momentum Indicators
Momentum signals are beginning to stabilize. The Relative Strength Index is positioned near the lower end of its recent range and is starting to turn upward, suggesting that downside pressure may be easing. Additional oscillators also reflect early signs of basing behavior.
Importantly, Bitcoin continues to hold above its long-term rising moving average, which has maintained a positive slope since the November 2022 pivot. This broader structural backdrop confirms that BTC remains in a higher-timeframe uptrend despite intermittent consolidation phases.
Why This Level Matters
The $69,141 region now represents more than a psychological round number. It marks the threshold between a dense historical participation zone and a relatively thin liquidity pocket.
If buyers sustain control while BTC trades within this low-volume corridor, price could advance through the gap at an accelerated pace. However, failure to maintain strength may result in rotation back toward higher participation zones below, where liquidity and historical support are more concentrated.
Outlook for the Coming Sessions
Bitcoin’s progression into this volume gap is a development worth monitoring closely. Price behavior inside low-liquidity regions often determines whether markets enter expansion phases or revert to range-bound conditions.
With momentum indicators stabilizing and BTC maintaining its broader uptrend structure, the next several sessions may prove decisive. Market participants will watch whether Bitcoin can hold above $69,141 and traverse the gap, or whether supply reemerges before a full move through the thinner liquidity zone.
Source: Jake Wujastyk