
Silver Price Prediction: Dark Cloud Signals Pullback at 0.618 Fibonacci Level
Silver has recently approached a technically important resistance area after a strong recovery from early February lows. However, the appearance of a bearish candlestick pattern near the 0.618 Fibonacci retracement level has raised concerns that the recent rally may be losing momentum. With price now consolidating near the 50-day exponential moving average, traders are closely watching whether the metal will stabilize above support or begin a deeper pullback.
Bearish Reversal Appears at Key Fibonacci Resistance
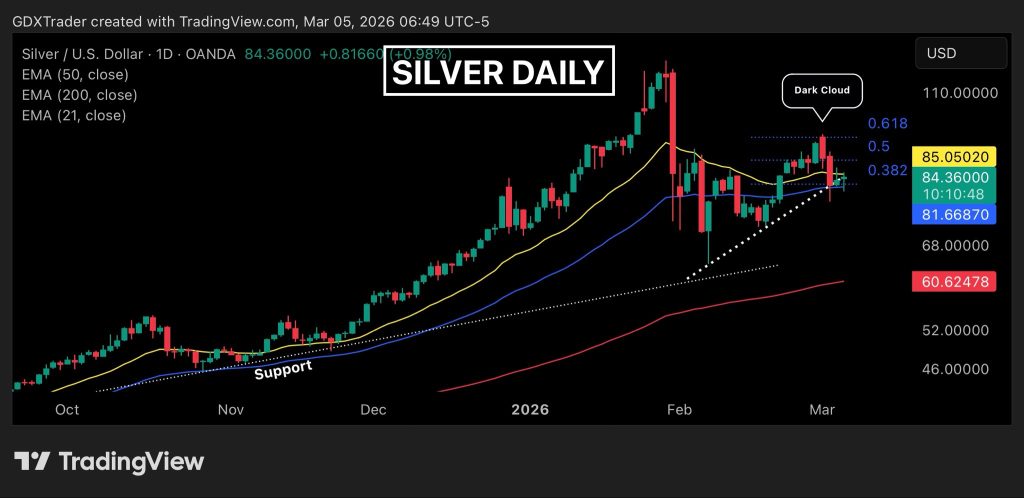
Silver has encountered technical resistance near a key Fibonacci retracement level, triggering caution among traders after a bearish candlestick pattern appeared on the daily chart. Market analyst GDXTrader recently highlighted that the Silver/U.S. Dollar (XAG/USD) 1-day chart shows Monday’s rally stalling at the 0.618 Fibonacci retracement of the bounce that began in early February.
At this level, the chart printed a dark cloud cover formation, a well-known bearish reversal signal that often appears near resistance zones. Tuesday’s candle confirmed the pattern with a continuation to the downside, suggesting that the recent bullish momentum may be slowing and that consolidation or a short-term retracement could follow.
The rejection occurred within a broader cluster of Fibonacci resistance levels, including the 0.382, 0.5, and 0.618 retracement zones. These levels frequently act as areas where strong trends pause or reverse. In this case, the bearish confirmation candle strengthened the signal that the previous upward move may temporarily lose momentum, shifting the market into a consolidation phase rather than immediate continuation.
Sideways Price Action Reflects Market Indecision
Over the past two sessions, price action has moved into a sideways range, indicating growing hesitation among both buyers and sellers. Today’s spinning top candle, which formed just above the 50 EMA, highlights this uncertainty. A spinning top usually reflects a balance between buying and selling pressure and often appears when the market is deciding on its next direction.
At the moment, the 50-day exponential moving average has become the most important technical level to monitor. As long as price remains above this dynamic support, the broader bullish structure may stay intact. In this scenario, the current pause could simply represent a healthy consolidation before the next directional move develops.
Broader Technical Scenarios Still in Play
Recent market commentary has also emphasized the significance of this support area in shaping the next trend. For example, recent analysis discussing how bulls defended the 50 EMA support zone after a two-day pullback highlighted the importance of this level in maintaining bullish structure.
Additional technical perspectives have also pointed to possible recovery setups. One example is the recent discussion of a falling wedge pattern that could trigger a bounce from the 82-84 zone, which outlines a potential bullish reversal scenario if buyers regain momentum.
At the same time, broader upside scenarios remain part of the bigger picture. Another recent market outlook describing how XAG/USD could target a 96.40 breakout after rallying from 92 illustrates the longer-term bullish potential if resistance levels are eventually cleared.
Outlook: Waiting for a Clear Breakout
For now, the short-term outlook remains neutral. The current structure does not present a high-probability setup with favorable risk-to-reward conditions on the daily chart. Because of this, traders may prefer to wait for a decisive breakout above resistance or a breakdown below support before entering new positions.