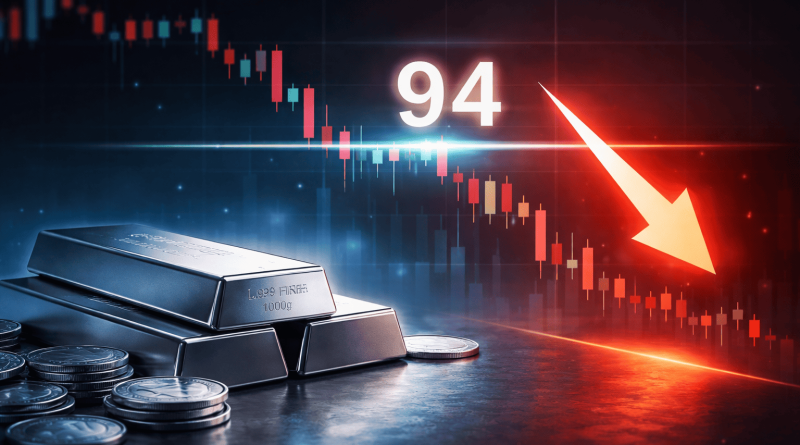
Silver Faces Bearish Reversal at $94 R1 Pivot Level
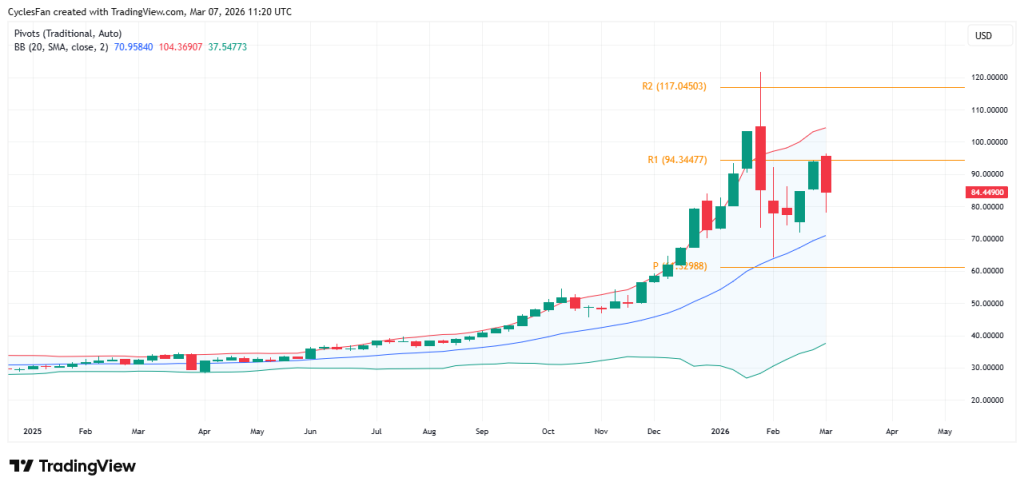
The silver market is showing signs of a near-term correction after a strong rally that carried prices through most of 2025 and into early 2026. Weekly chart analysis reveals that the metal recently tested a major resistance zone before pulling back sharply, increasing the likelihood of further downside pressure in the coming weeks.
Recent technical developments reinforce this view. Patterns discussed in silver price prediction: dark cloud signals pullback at the 0.618 Fibonacci level already pointed to exhaustion signals following the latest surge, suggesting that bullish momentum was beginning to weaken even before the current rejection.
Bearish Engulfing Forms at the R1 Pivot
Silver reached the yearly R1 pivot near $94.34, where upward momentum stalled and produced a bearish engulfing candle. This price action is widely viewed as a reversal signal, especially when it forms near significant resistance after an extended move higher.
The pivot structure highlights several key price levels that traders monitor closely. The main pivot P sits around $62.39, while R1 is located near $94.34 and R2 stands around $117.04. The rejection at R1 shows how this level is currently acting as a strong barrier for bullish continuation.
20-Week Moving Average Becomes Key Support
Market participants are now closely watching the 20-week moving average, which appears on the chart as a blue trend line. This indicator often acts as dynamic support during sustained uptrends, and previous price action suggests silver may again move toward this level.
A similar corrective pattern unfolded earlier this year when silver briefly declined toward the moving average before attempting another rally. Technical observations discussed in silver price prediction: bulls defend 50 EMA support zone after 2-day pullback also emphasize how moving averages frequently become critical support zones during consolidation phases.
If the price approaches the 20-week moving average, traders will likely evaluate whether buyers step back into the market.
Consolidation Before the Next Major Move
The current market structure challenges the assumption that silver will immediately resume its climb toward new all time highs. Instead, the market may require a longer consolidation phase before attempting another major breakout.
Additional chart patterns referenced in silver price prediction: falling wedge pattern may trigger bounce from the $82–$84 zone highlight alternative downside scenarios that could unfold during this correction. Such formations suggest the possibility of deeper pullbacks before any sustained recovery attempt.
At the moment, the bearish engulfing candle near the R1 pivot indicates that sellers are becoming more aggressive.