
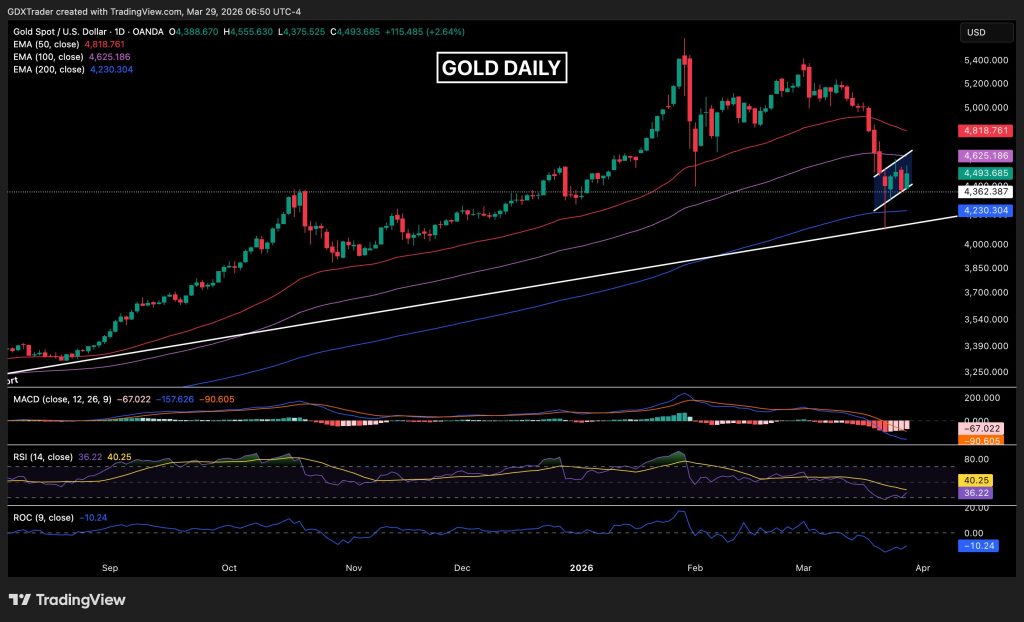
Gold Price News: RSI Rebounds from Sub-30 Levels but Bear Flag Threatens Further Decline
Gold is attempting a short-term recovery after reaching oversold conditions, but the broader technical structure still signals weakness. While momentum indicators show early stabilization, price action continues to reflect a corrective phase rather than a confirmed reversal.
Recent technical patterns suggest that gold may be entering a critical decision zone as April approaches.
RSI Recovery Signals Short-Term Stabilization
Gold recently printed a bullish continuation candle after the RSI dropped below 30, a level typically associated with extreme selling pressure. Since then, the indicator has recovered toward the mid-30s, suggesting that downside momentum may be slowing.
Such RSI rebounds often trigger short-term buying interest as traders look for relief rallies after aggressive selloffs. However, these moves do not automatically signal a trend reversal and often remain corrective unless confirmed by stronger structural shifts.
Bearish Structure Remains Intact
Despite the short-term bounce, the broader market structure remains bearish. Since January, gold has continued to form lower highs and lower lows, confirming that the market is still in a corrective phase following its previous bullish trend.
Price has also broken below its prior ascending trend support and continues trading under both the 50 EMA and 100 EMA. This positioning reinforces the presence of sustained selling pressure across multiple timeframes and suggests that bulls have not yet regained control.
Bear Flag Pattern Raises Downside Risk
The most important technical development is the bear flag formation currently developing just above the 200 EMA. This pattern typically signals continuation to the downside unless invalidated by strong bullish momentum.
This makes the current rebound look more like a corrective bounce rather than a confirmed reversal. For sentiment to change, buyers would need to break the flag structure and reclaim key moving averages.
A similar resistance-driven setup was discussed in Gold tests $4430-4450 resistance zone as breakout looms, showing how technical barriers continue to dictate short-term price behavior.
Key Levels That Could Change Momentum
For bulls to regain control, gold would need to break above the bear flag resistance and reclaim at least the 100 EMA with confirmation. Such a move could indicate a potential structural shift and open the path for a stronger recovery attempt.
Until then, patience remains essential as the market continues to search for direction within a corrective structure.
Similar technical dynamics were also discussed in Gold price holds $4410 support, targets $4520-4700 ahead, where support and resistance zones were identified as key drivers of the next potential move.
Momentum Indicators Show Mixed Signals
The broader technical environment suggests gold may be transitioning from trend expansion into a consolidation phase. Indicators such as a flattening MACD and improving rate of change suggest that selling pressure may be slowing.
However, none of these indicators yet confirm a full reversal. Instead, they point toward a market that is stabilizing but still vulnerable to further downside if resistance levels hold.
Conclusion
Overall, while momentum is showing early signs of stabilization, gold remains technically fragile unless key resistance levels are reclaimed. The current structure reflects short-term buyers attempting to generate a bounce within a broader pullback.
The next major move will likely depend on whether the bear flag resolves to the upside or continues the broader corrective trend.