
Gold Price Forecast: Bearish Structure Holds as Resistance Caps Recovery Attempts
Gold remains under technical pressure as price action continues to respect key resistance zones while bearish momentum dominates the broader structure. Recent candlestick formations and moving average positioning suggest the market is still searching for direction, but the advantage remains with sellers unless major resistance levels are reclaimed.
Market Structure Shows Weak Recovery Attempts
Technical analysis shows gold continuing to struggle below critical resistance levels as bearish pressure remains intact. Recent chart behavior suggests continued weakness, with sellers maintaining control despite oversold conditions that sometimes precede temporary rebounds.
The latest price action formed an inside candle, typically associated with short term stabilization. However, this pattern reflected indecision rather than strong accumulation. The following session confirmed weakness as a shooting star candle rejected higher prices, reinforcing the idea that buyers failed to maintain momentum.
At the same time, the broader structure remains fragile as seen when Gold breaks $4,320 support zones and highlights how recovery attempts continue to face strong technical barriers.
Moving Averages Continue To Act As Resistance
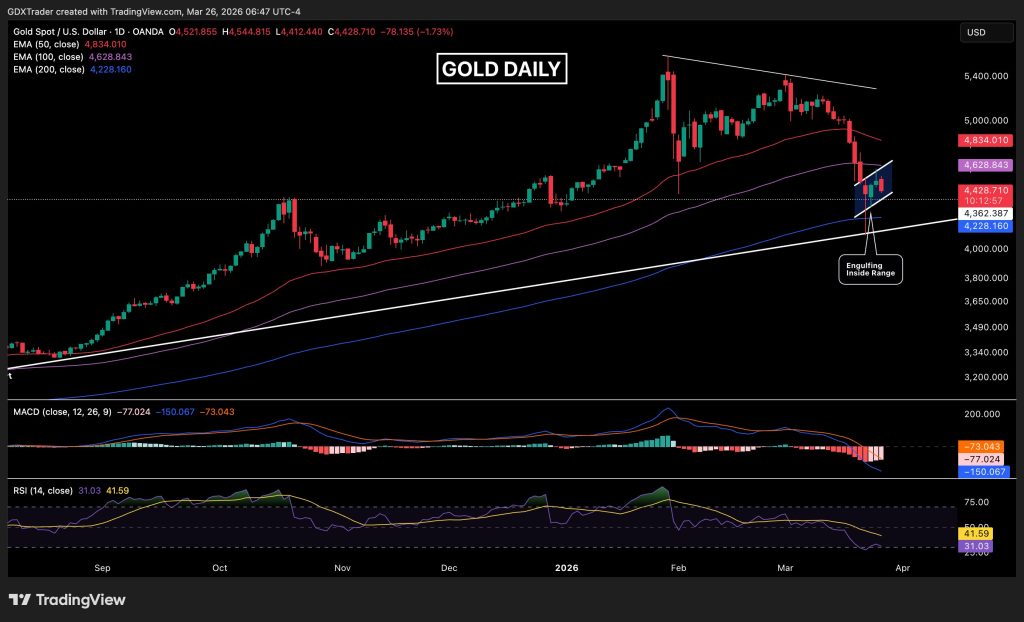
Gold is currently trading below important moving averages, with price interacting with a descending 100 EMA while the 50 EMA forms an additional resistance layer. This creates a stacked resistance structure that limits bullish scenarios unless price can reclaim these levels with strong momentum.
The current technical positioning suggests rallies may continue to be sold unless a clear structural shift develops. This type of behavior often appears during periods of elevated volatility, similar to conditions described when Gold volatility hits 1983 levels, where rapid price swings occurred within weak market structures.
Downside Risks Remain Elevated
A recent bearish engulfing candle further confirms that sellers remain in control. RSI near the 30 level indicates oversold conditions, but during established downtrends this often signals continuation rather than reversal.
Bull traps remain a significant risk in this environment, especially for traders attempting to buy early dips while the larger trend remains bearish.
Current consolidation may also be forming a bearish flag pattern, typically considered a continuation setup. This suggests the current sideways movement could act as preparation for another move lower if resistance continues to hold.
Key Levels To Watch
Resistance between $4,430 and $4,450 remains the most important technical zone. A sustained move above this region would be required to weaken the bearish structure.
Price behavior near Gold tests $4,430-$4,450 resistance zone may ultimately decide whether sellers extend control or whether buyers can build a meaningful recovery attempt.
Until that happens, the most probable scenario remains continued consolidation with downside risk.