
Gold Breaks $4,320 Support as Bearish Trend Intensifies
Gold recently entered a high volatility phase after breaking an important technical support zone, triggering a strong bearish move followed by consolidation. The current price structure shows a technically driven market environment where traders are closely watching key resistance and support zones to determine the next directional move.
Market participants are now evaluating whether the recent decline represents continuation of the bearish trend or simply a temporary correction before stabilization.
Technical Breakdown Triggers Sharp Decline
Gold experienced a significant technical breakdown after losing a major support level, triggering a fast decline before entering a consolidation range. The move reflects increasing short term volatility in the gold market as price reacts to technical pressure and key liquidity zones.
According to the chart structure, gold broke below the $4,320 level, which acted as an important technical support area. Following this breakdown, XAU/USD dropped toward approximately $4,099 before staging a rebound toward the $4,200 area. The sequence shows a strong downward impulse followed by a partial recovery and sideways movement.
At the moment, price action suggests consolidation after the decline rather than a confirmed reversal, with traders watching how Gold volatility hits 1983 levels in recent sessions.
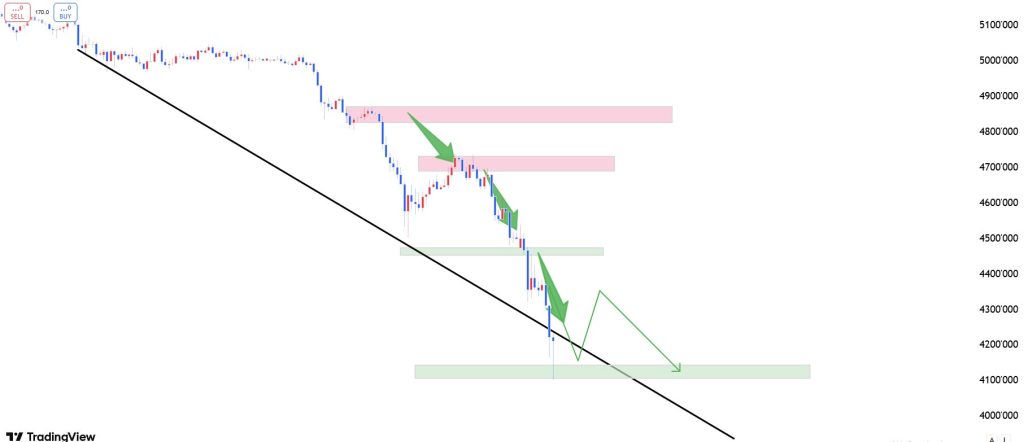
Two Key Scenarios Emerge
The analysis highlights two main scenarios based on current price behavior.
One scenario suggests that if gold rebounds toward the $4,250 area, this level could act as resistance and potentially create another downside move if bearish momentum continues. Another scenario focuses on the $4,100 region as a possible stabilization zone where buyers could attempt to defend support.
The price broke below 4320 and fell to around 4099 before rebounding near 4200.
Traders may watch a rebound toward $4,250 for possible short setups or monitor the $4,100 zone for signs of stabilization. These observations align with the consolidation pattern visible on the chart and reflect a technically driven market phase rather than a fundamentally driven move.
This dynamic echoes the way Gold tests $5000 support during previous volatile periods.
What This Means for Gold Price Prediction
The recent XAU/USD movement shows how gold price prediction models often depend on how price reacts after major support breaks. With gold currently trading inside a consolidation range after a sharp decline, the next reactions around resistance and support levels may determine whether volatility expands again or whether the market enters a broader stabilization phase.
Some analysts compare current conditions to when XAU breakout signals potential rally, suggesting that post breakdown consolidation can precede significant directional moves.