
Copper/Gold Ratio Drops to Historic Lows in 2025 as Safe-Haven Demand Surges
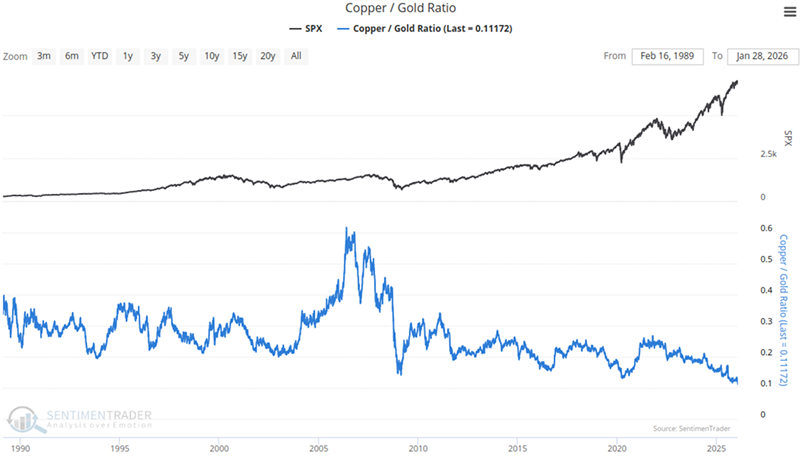
The Copper/Gold Ratio has dropped to one of its lowest levels on record in 2025, highlighting a sharp shift in investor sentiment toward safety. Between August and October, the ratio continued making new lows, reflecting gold’s strong outperformance versus copper at a time when economic confidence is deteriorating.
This divergence is particularly notable because it has occurred while equity markets remain near highs, underscoring a growing disconnect between cyclical assets and defensive positioning.
Key Market Signals:
1. What the Copper/Gold Ratio Indicates
The Copper/Gold Ratio is widely viewed as a macroeconomic barometer. Copper is closely tied to industrial demand and global growth, while gold is a traditional safe-haven asset. When the ratio declines sharply, it typically signals rising economic stress and increased demand for defensive assets.
According to analysis shared by SentimenTrader, the ratio reached near multi-decade lows in late 2025, a level historically associated with elevated market caution.
2. Historical Performance After Similar Extremes
Past data suggests that extreme lows in the Copper/Gold Ratio have often been followed by strong gold performance. In every comparable historical instance, gold posted positive returns over the following 12 months, with average gains of approximately 10.6 percent.
As noted in the analysis:
“The Copper/Gold Ratio has reached one of its lowest levels on record, with gold posting positive 12-month returns in 100% of historical instances following similar extremes.”
This reinforces gold’s role as the preferred asset during periods of slowing growth and declining confidence in industrial demand.
Cross-Asset Impact
Other assets have shown more mixed behavior following similar signals. Gold mining stocks, tracked through GDX, typically gained around 13.4 percent over the subsequent year, but often experienced sharp short-term drawdowns of up to 13.7 percent within the first month.
Copper futures historically rose about 14.0 percent over 12 months after such extremes, suggesting that copper can recover once growth fears stabilize. Meanwhile, the U.S. Dollar Index tended to decline by roughly 10.6 percent as capital rotated out of cash and into hard assets.
Why This Matters
The current setup highlights a clear divergence between defensive and cyclical assets. While equities continue to push higher, the Copper/Gold Ratio is signaling caution beneath the surface. This type of split has historically preceded periods of increased volatility or economic slowdown.
However, the signal is not without limitations. The historical sample size is small, with only five to eight comparable instances, which reduces statistical confidence.
Outlook and Risks
While gold’s historical performance following these signals appears compelling, the current macro backdrop introduces new uncertainties. A stagflationary environment could weaken gold’s traditional defensive role and disrupt established market patterns.
Rather than serving as a guaranteed directional signal, the Copper/Gold Ratio should be viewed as a warning sign of growing market nervousness and rising macro risk.
Final Take
The drop in the Copper/Gold Ratio to historic lows is a development worth watching closely. It reflects increasing demand for safety at a time when headline equity markets remain strong. While history favors gold after such extremes, limited data and evolving macro risks suggest caution when extrapolating past outcomes into 2026.